Discover the top mobile app metrics for growth marketing from user acquisition and retention to lifetime value (LTV), ARPU, and referral rate. Category Metric name What it measures Acquisition Metrics Install Rate Cost per Install (CPI) Click-Through Rate (CTR) Ratio of people who click on your ad to those who view your ad Activation Metrics Onboarding Completion Rate Calculating the % of users who complete the onboarding process Time to First Key Action Engagement Metrics Daily Active Users (DAU) Monthly Active Users (MAU) The number of unique people who engage monthly Session Length Average time of a session for a user Session Frequency Average number of sessions per user during a specified time frame Retention Metrics Retention Rate Percentage of users who return after a specific time Churn Rate % of users who stop using the app within a period of time Monetization Metrics Total revenue per active user Total earnings from the lifetime of the user Conversion Rate % of users who complete a monetization action Performance Metrics Crash Rate Percentage of sessions that end in a crash App Load Time Average time for your app to open or load content Referral Metrics Viral Coefficient Number of new users each current user refers Referral Rate The percentage of users who invite others to use your app Measures satisfaction and advocacy potential Schedule a Free Demo Schedule a Free Demo TALK TO AN EXPERT 1. ❓What are app metrics? 2. ❓How to measure mobile app performance? 3. ❓What is the difference between KPI vs metrics? 4. ❓How do we calculate ROI? 5. ❓What is a conversion rate?
Table of Contents
Pour months or even years into building your app, and it should just work. But then you open your analytics dashboard. Your numbers don’t add up because retention is slipping, customer acquisition cost is increasing, and revenue is flat. One report says users love your product, while another says they’re disappearing fast.
What you have is a compass pointing in all directions, leaving you clueless.
There will be even more applications competing by 2026. Strict privacy laws will be introduced, and AI will transform the decision-making process of the team. And every new user costs a little more than before.
On average, apps lose 77% of daily active users within 3 days of being downloaded.
If your growth plan focuses on app downloads, clicks, or installs, consider digging deeper. So this guide is your clarity in the chaos. A growth-first framework for reading the right signals and tracking numbers, but understanding them.
Inside, you’ll find:
- The core mobile app metrics that drive real growth (and how to calculate them)
- Industry benchmarks to know what “key” metrics for a mobile app look like
- Practical ways to turn mobile app KPIs into levers for acquisition, retention, and monetization
Mobile App Metrics: An Introduction
For growth marketing, here are mobile application metrics that you need to track:
Why it matters
The % of users who install your app after it has been publicly showcased in the store
Shows how well your app store listing and marketing are doing
Average procurement cost for one new app installation
Measure marketing performance and maximize ad spend
This measures ad relevance and creative performance
Measures how well your visitors are acquainted with your core values
How long does it take new users to take a meaningful action(e.g., first purchase)
Shows ease of use and engagement quality
Number of daily new unique users who interact with your app
Key indicator of continuity of engagement and "stickiness" of the app
Meets long-term engagement and audience size
Indicates depth of mobile app engagement and user satisfaction
Shows user habit formation and their usage of an app
A key indicator of product-market fit and user loyalty
Determines churn rate, which is the inverse of retention
Average Revenue Per User (ARPU)
Calculates the value created by each user
Customer Lifetime Value (LTV)
Directs investment for long-term marketing and retention
Measures the effectiveness of the in-app monetization strategies
High crash rates directly hurt retention and app ratings
Affects application user experience and early abandonment risk
Demonstrates organic growth and word-of-mouth success
Get expert support to launch and scale your mobile app
How to Prioritize App Metrics by Growth Stage
You cannot always pay attention to all metrics simultaneously. The only thing is that you should know which metrics to track for sustainable growth. Here are the measurement metrics to measure:
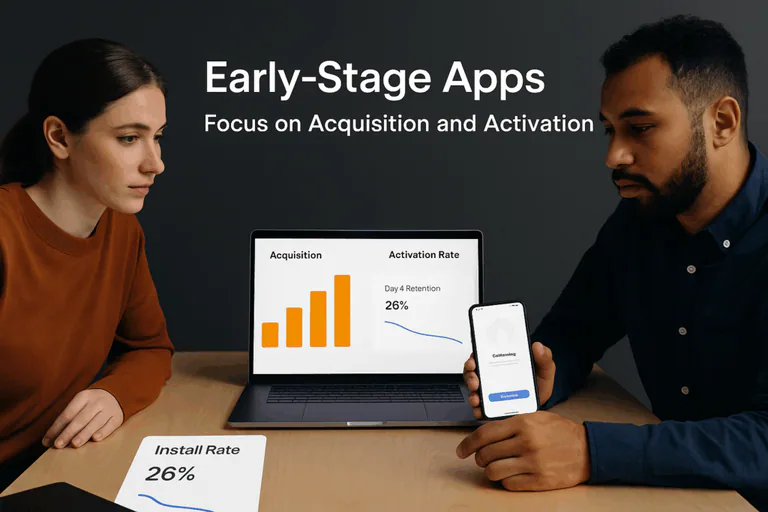
Early-Stage Apps: Activation and Acquisition.
At the early stage of your app, your most important objective is validation, showing that other people desire what you have created.
And that starts with acquisition and activation metrics.
- How many people find your app?
- How many people install your app?
- How many people do you retain?
Adjust reported that the average Day-1 retention rate in the apps-in-categories is 26%, and decreases to 13% after Day-7. The retention rate stabilizes at 7% in 30 days, making retention rate a key app usage metric to monitor.
Hence, during the early stage, you ensure less friction.
Track:
- How many users install your app (Install Rate)?
- How efficiently do you acquire them (Cost per Install)?
- How many complete onboarding (Activation Rate)?
Example:
A new health wellness app realized that only 35% of users completed onboarding. The account opening process was reduced by 50% and a “Skip for now” button was added to increase completion to 65%. As a result, Day-1 retention increased by 20%.
During the early stage, you should simplify onboarding, prove product-market fit, mobile app marketing, and demand validation.
Scaling Apps: Double Down on Retention and Engagement
After your acquisition strategies are working, you struggle to retain and engage them.
The data highlights that the retention on Day-1 among apps is on average 25% and Day-30 is frequently between 5-6%.
In more narrow categories, gaming apps had 8.7% retention on Day 7 and 3% on Day 30.
For finance apps, the 7-day retention benchmark is 18.5%.
Attrition is cruel, making engagement your lifeline. Indicators, such as DAU/MAU ratio, session length, frequency of session, feature adoption, and cohort retention curves, allow you to see that people are becoming habitual or moving away.
This is where engagement becomes your north star. Monitor DAU/MAU ratios, session duration, feature adoption, and all indications of the level of engagement of users with your mobile app.
Example:
The engagement rate dropped in one of the fintech apps after the initial week. Adding weekly goal reminders, push notifications, and tracking streaks in the application increased the 30-day retention and average session duration by a quarter and two minutes, respectively.
During this second stage, you create habits, enable more user interaction, and make your app something that the user uses regularly.
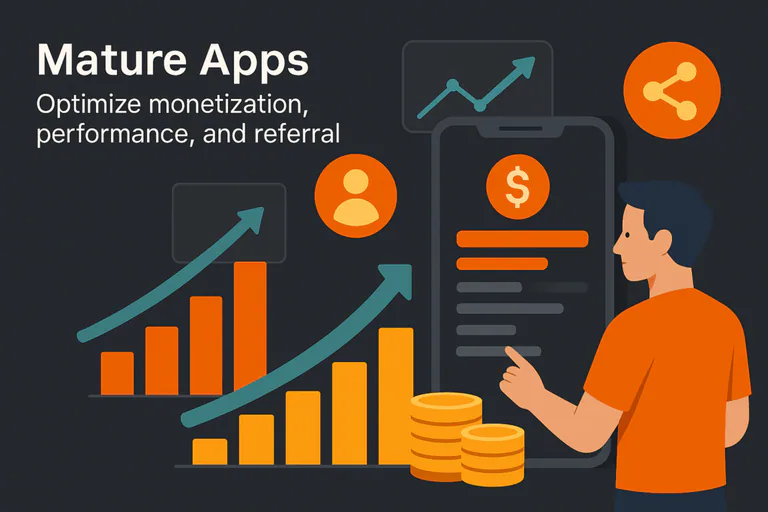
Mature Apps: Optimize monetization and performance
Once you have a powerful and consistent user base for your application, you will witness higher profits and performance.
Even minor changes can get disproportionately large payoffs. According to Google research, the longer the mobile page load time, the user bounce rate increases by 32% as the load time increases from 1 to 3 seconds.
This is where LTV, ARPU, and Referral Rate metrics ensure long-term growth. When your mobile app has a strong, loyal user base, you encounter higher profitability and performance.
Example:
A gaming app decreased the load time from 4 seconds to 2.5 seconds. The result? The in-app purchases grew by 15% and the churn in the first week decreased by 10%.
The idea is to become more efficient in monetizing things, retain performance, and convert happy users into evangelists.
Wondering what mobile app development really looks like with AI?
How OpenForge Makes Metrics Measurable Growth?
Measuring metrics is one thing, and leveraging them to foster actual results is another. That’s where OpenForge comes in. As a growth-focused app development partner, OpenForge helps teams fill the gap between analytics and action.
From the moment your app is built, they implement data tracking frameworks to capture the right metrics. Their specialists then decode the numbers using a data-to-design workflow, relating the insights of user behavior to UX optimization, app store optimization, onboarding, and user engagement loops.
Your goal can be improving retention from Day-1, enhancing your onboarding, increasing LTV by adding more innovative in-app monetization, or creating dashboards. This helps you make informed decisions at every stage of the app experience. Quantifiable expansion, increased retention, and a roadmap from MVP to market leader.
Building Apps That Grow with Clarity
Clarity brings growth in the present app economy. Mobile app performance metrics provide a number on a dashboard, but they are a finger that provides a pointer on every decision, onboarding design, and long-term retention and monetization.
When you understand which numbers truly matter at each stage of your app's lifecycle and apply them to optimize your product experience, you can make informed changes, rather than forced ones.
OpenForge bridges the gap between insights and impact. With development-oriented models, in-built analytics, and user experience optimizations, OpenForge converts fragmented data in a way that enhances user loyalty and leads to sustainable revenue. To know how we can help, schedule a call with us.
Frequently Asked Questions
Metric mobile apps are quantifiable measurements, such as retention, engagement, or churn, and indicate how your mobile app is doing and developing.
Through mobile app analytics metrics, you can monitor key performance indicators such as downloads, retention, crashes, and revenue, user behavior, performance statistics, and business results.
The metrics are general data points, whereas KPIs are a few metrics that clearly tell whether your app is successful or on track.
To calculate the ROI, use the formula ROI = (Total Revenue – Total Costs) ÷ Total Costs × 100. ROI indicates the percentage of returns your app produces against the cost you incurred.
The app conversion rate is the percentage of your users who take a preferred course of action, i.e., the users who sign up, subscribe, or buy whatever you are selling.